





A Data Story · Global Streaming Analysis

What Netflix's library
tells us about the world.

An empirical analysis of 8,807 Netflix titles released across 86 countries. Tracing the platform's evolution from a domestic American movie archive into an interconnected international cultural powerhouse.

8,807 Catalog Titles
86 Countries Represented
69.6% Movies vs 30.4% Shows
2021 Snapshot Horizon
Scroll to explore
Chapter 01 / Catalog Trajectory

The library
exploded.

2008–2015 · The Early Domestic Era

In 2015, Netflix added just 82 titles to its library. The year before, it had added 24. Library expansion was cautious, heavily licensed, and almost exclusively domestic American media.

2016 · The Global Inflexion Point

Then came January 2016. CEO Reed Hastings announced simultaneous launches in 130 new countries at CES. Additions surged to 429 titles in twelve months—a 420% single-year increase.

2019 · Peak Additions

By 2019, Netflix added 2,016 titles in a single calendar year—averaging 5.5 new releases every single day. The streaming wars prompted unprecedented commissioning budgets across Europe, Asia, and Latin America.

2021 · The Modern Catalog

By late 2021, the cumulative active catalog reached 8,807 titles, establishing the most geographically diverse digital video subscription library in media history.

Cumulative titles added to Netflix · 2008 to 2021
Source: Kaggle Netflix Titles Dataset (Shivam Bansal) · Hover line nodes for yearly figures.
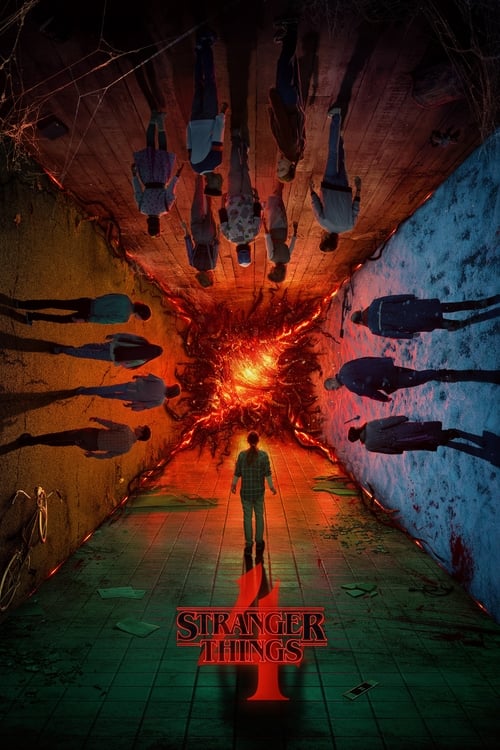
Stranger Things
Stranger Things (2016)
Global Hit
Ozark
Ozark (2017)
Original
130+
Countries added in a single keynote in January 2016. Yearly title additions immediately jumped from 82 to 429, permanently decoupling Netflix from US cable licensing constraints.
Chapter 02 / Geography Shift

America built
the foundation.
Then the world arrived.

2013 · The American Monopoly

In 2013, 91% of all titles added to the catalog originated in the United States. Viewers around the world essentially accessed an American domestic television schedule.

2016 · Crossing the Threshold

By 2016, international additions flipped the scales: the US share plunged to 41.7%. For the first time, non-US productions accounted for the majority of new library inventory.

2018–2021 · The 35% Equilibrium

From 2018 onwards, American titles stabilized at roughly 36% to 38% of annual additions. While the US remains the single largest national contributor with 3,211 titles, foreign content drives overall volume.

United States vs Rest of the World · Additions by Year
United States Share
Rest of World
Percentages indicate the US proportion of total additions in that calendar year.
Mindhunter
Mindhunter
US 36%
Tiger King
Tiger King
US 36%
Chapter 03 / The Global Map

86 countries.
One platform.

The United States (3,211), India (1,008), and the United Kingdom (628) form the top triumvirate, producing over 55% of all catalog entries. The remaining 83 nations highlight distinct storytelling archetypes.

Quick Spotlight:
Bubble radius = title count · Color = Movie-heavy (Red >60%) vs TV-Show heavy (Blue >60%) · Hover or click bubble for exact breakdown
Movie-dominated (>60% Feature Films)
Show-dominated (>60% Episodic TV)
Balanced Catalog
92%
of Indian catalog titles
are feature films (927 of 1,008)
VS
78%
of South Korean titles
are episodic series (164 of 211)
Chapter 04 / Contrasting Strategies

Two strategies.
One platform.

India · Bollywood Digital Showcase

India integrated its prolific theatrical film industry directly onto Netflix. Out of 1,008 titles, 927 are movies and only 81 are episodic shows. The strategy focused on rapid acquisition of celebrated Bollywood, Tamil, and Telugu cinema.

South Korea · The Episodic Engine

South Korea adopted the exact opposite philosophy. Out of 211 titles, 164 are multi-episode K-dramas. With Squid Game, Crash Landing on You, and Vincenzo, Korean series generated sustained international binge-viewing.

100-Tile Waffle Matrix

Each tile represents 1% of the country's library footprint. Red squares indicate films; blue indicates TV series. The strategic divergence between the two Asian giants is immediately apparent.

Waffle Matrix · 1 Square = 1% of National Catalog
India
1,008 Titles · 92% Movies
92%
Movies (927 Titles)
South Korea
211 Titles · 78% TV Shows
78%
TV Shows (164 Titles)
Sacred Games
Sacred Games (India)
81 Shows
Vincenzo
Vincenzo (Korea)
164 Shows
Chapter 05 / Audience Maturity

Netflix
grew up.

2016 · Adult Shift Begins

In 2016, adult-rated programming (TV-MA, R, NC-17) accounted for 41.3% of new additions, driven by prestige dramas and uninhibited streaming originals.

2019 · Peak Mature Share

By 2019, adult content rose to 46.9% (945 of 2,016 additions). As subscriber demographics matured, edgy thrillers, true crime docuseries, and dark comedies dominated commissioning orders.

Category Distribution

Kids & Family content expanded steadily in absolute volume (averaging ~350 titles annually), but adult and teen (TV-14) releases consistently dominated library growth.

Content Rating Segments by Year · 2013 to 2021
Adult (TV-MA, R)
Teen (TV-14, PG-13)
Family (TV-PG, PG)
Kids (TV-Y, G)
Hover any segment for exact volume and percentage breakdown.
Black Mirror
Black Mirror
TV-MA 47%
Dark
Dark
TV-MA 47%
3,207
Total TV-MA and R-rated mature titles in the catalog (36.4% of all titles), making adult programming the single largest demographic slice on the platform.

The library reflects who Netflix wanted to reach.

From 2 titles in 2008 to 8,807 in 2021. From 91% American to 36%. From single-region movies to a bilingual tapestry spanning Seoul, Mumbai, London, and Lagos. Every number in this dataset represents an editorial bet on international culture.

This analysis covers the catalog through late 2021. Subsequent eras—including password sharing changes, ad-supported tiers, and localized live sports—mark the next chapter in streaming history.